Managing the Transit Network
We regularly review and adjust our transit services as the region’s needs evolve. Doing so enables us to better serve our customers throughout Metro Vancouver. We're continually working to serve more people, provide new connections, and reduce overcrowding within our current resources.
Managing the transit network involves developing policies, guidelines, and performance indicators for transit service. We apply this guidance in developing, evaluating, and implementing transit service changes.
Network Design Objectives
TransLink manages and invests in the regional transit network with the assumption that public transit offers a wide range of benefits to the people who live in Metro Vancouver
To achieve these benefits, we follow three simple objectives when designing and managing the transit network:
-
Maximize ridership
-
Encourage long-term ridership growth
-
Provide access to transit service across the region
All three objectives are important, but sometimes trade-offs must be made. Making these decisions is where we ask for input and guidance from our partners and the public.
Maximize Ridership
Maximizing ridership involves meeting existing demand for transit service. Services designed to build ridership tend to target areas that have many people working or living in proximity, such as a downtown core, an urban centre, or along a well-developed corridor.
We maximize ridership by:
-
Providing reliable and predictable service.
-
Providing more and/or better service where there is already high ridership or overcrowding.
-
Providing service where there is anticipated to be high ridership, typically where there is some mix of:
-
higher residential or commercial density
-
major activity centres
-
pedestrian networks that make walking easy and pleasant
-
measures that discourage driving, such as limited or expensive parking
-
Using existing transit infrastructure as efficiently as possible, such as transit priority measures, rapid transit lines, and bus exchanges.
-
Improving the way people make transit connections so they can reach more destinations in less time.
Encourage Ridership Growth
Encouraging long-term ridership growth involves building capacity to meet future demand for transit service. We make long-term strategic investments that will gradually grow ridership by supporting transit-oriented development.
We encourage long-term ridership growth by:
-
Providing transit service to major new development areas where we expect strong ridership growth.
-
Providing frequent, all-day service along key corridors to encourage development of communities whose design makes good use of transit resources.
-
Informing developers and municipalities about the likely service and mobility outcomes of various land use and development options.
-
Limiting service expansion in areas where transit services are unlikely to be efficient or productive, such as remote or hard to serve areas, or where population is unlikely to grow.
Provide Regional Access
Providing access to transit service across the region involves maximizing the transit network coverage and ensuring a basic level of service is available to most people for most kinds of trips. Part of our mandate is to serve the needs of people who depend on transit due to age, disability, or other limitations. Given limited financial resources, we must make difficult decisions about how to meet our mandate, while also providing service where demand is greatest, and we can expect high ridership. In some places, we simply can’t provide public transit in a reasonably efficient way. Instead, people in these areas may have to rely on other modes of transportation.
TransLink provides access to transit service across the region by:
-
Providing basic, low-frequency transit service in areas of lower density where possible.
-
Ensuring our services are fully accessible to people of all ages and abilities.
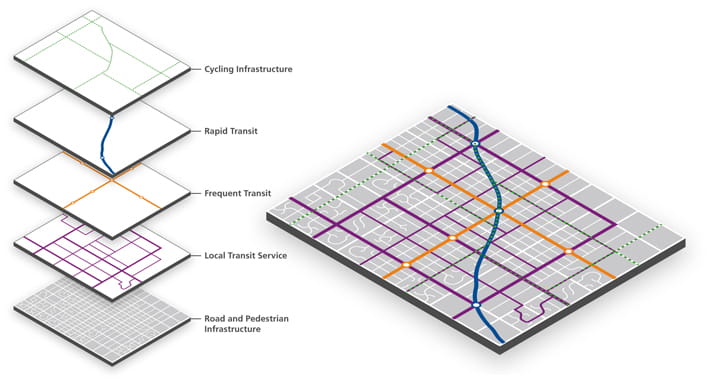
Network Design Themes
The way we address our Network Design Objectives varies depending on the individual context, including the local street network, topography and transit ridership. Ridership is influenced, among other factors, by land use, street connectivity, and proximity to major activities centres. These considerations inform how we design the transit network to best serve customers across the region.
When considering how to design the transit network to best serve customers across the region, we design with key themes in mind: network integration, versatility, efficiency and productivity and partnerships and collaboration.
Network Integration
For the best mobility, locate where transit service is most frequent.
Transit ridership grows the most in places where more customers live and where there are more destinations that they want to reach. Because of this, denser, mixed-use developments with walkable streets can support higher levels of transit service. TransLink works with our municipal partners and other stakeholders to ensure the coordination of land use and transportation planning so that development can be served with more frequent transit service.
Versatility
Specialized transit is less effective transit.
We try to design services that are versatile to enable freedom of movement for a diverse range of people and trips.
Efficiency & Productivity
Efficient transit allows us to provide more transit.
We work to serve as many customers as possible with the budget we have. We do this by matching service with the times and places that customers want to use the system.
Partnerships & Collaboration
For the best mobility, locate where transit service is most frequent.
Transit ridership doesn’t grow simply because we add more service. Development affects ridership demand and supports higher levels of transit service. We work with our municipal partners and other stakeholders to ensure the coordination of land use and transportation planning so that development patterns support an efficient and productive transit network.
Transit Service Guidelines
We use our Transit Services Guidelines to support decision-making related to adding, adjusting, or eliminating transit service. The Transit Service Guidelines bring clarity and consistency to that process to meet changing customer needs. They are founded on the principle of being: accountable, balanced, and collaborative.
Accountable: Has clear expectations for performance, demand, service quality, and customer expectations.
Balanced: Considers customers first, along with the needs of local communities, while ensuring the efficient and appropriate use of resources.
Collaborative: Builds upon partnerships with the public, local government partners, and stakeholders to identify and address issues and opportunities proactively and collaboratively.
The guidelines are designed to provide flexibility in response to customer needs and community expectations in an accountable, equitable, and efficient manner. They also communicate expectations for service delivery to partner agencies and local governments, as well as to TransLink’s customers and the public.
The guidelines typically define minimum thresholds, which are often exceeded when applied to actual service. They apply to conventional transit services, which include bus, ferry (SeaBus), and rail (SkyTrain, Canada Line, and West Coast Express).
2022 Transit Service Performance Review
The Transit Service Performance Review (TSPR) is published annually and provides a comprehensive review of ridership trends across all modes of our transit system.
The 2022 TSPR primarily analyzes data from fall 2022. Historically, the fall represents the most stable and highest ridership across the network. The report illustrates how ridership compared to pre-pandemic levels – referred to as “ridership recovery” - by comparing data to fall 2019, the last full year prior to the pandemic. The TSPR’s findings help guide our decision making and inform network adjustments, to ensure our services best meet the needs of our customers.
This year also signals the return of our online interactive dashboards which provide route level key performance indicators and stop level data. These can be found below.
Annual journeys across the system totalled 193.6 million in 2022, a 48% increase over 2021 and over 70% of levels in 2019.
TransLink was the first transit agency in Canada and the United States to reach 80% ridership recovery (in fall 2022).
TransLink ranked 5th in Canada and the United States in total transit boardings in 2022, despite being 24th in regional population.
Ridership continued to return slightly more on weekends than on weekdays.
Despite having the lowest rates of ridership recovery, ridership in the Vancouver/UBC sub-region accounted for 47% of system-wide ridership – the most of any part of Metro Vancouver.
The Southeast sub-region (Surrey, Langley Township, Langley City, White Rock, and North Delta) was the leader in ridership recovery, with some routes exceeding 100% ridership recovery.
Overcrowding on the bus system approached pre-pandemic levels through 2022 (approximately 8.2% in October 2022 compared to 10% pre-pandemic).
2022 TSPR - Links & Documents
Dashboard Links
-
Interactive 2022 TSPR mapping tool (including bus stop data)
-
Data Exploration & Download (Mobile-friendly version)
-
The Exchange Data Exploration & Download (Mobile-friendly version)
CSV Downloads
When you download this data, you are agreeing to TransLink's data license. Please note that bus CSV files do not contain discontinued routes.
Bus & SeaBus Data
-
Bus: Seasonal indicators by route, day type, season, time range, and year
-
SeaBus: Seasonal indicators by day type, season, time range, and year
-
SeaBus: Passenger volume by day type, season, direction, and hour
SkyTrain & West Coast Express Data
TSPR Archive
2021 Transit Service Performance Review
The Transit Service Performance Review (TSPR) is published annually and provides a comprehensive review of ridership trends across all modes of our transit system.
Given the fluctuations in ridership over the course of 2021 due to evolving public health restrictions, there was no “average” day in 2021. For this reason, the 2021 TSPR focuses on the most stable period of ridership – September to December – instead of the entire year.
The TSPR’s findings help guide our decision making and inform network adjustments, to ensure our services best meet the needs of our customers.
Key findings of the 2021 TSPR:
-
In fall 2021, nearly 2.2 million unique customers used the transit system, equivalent to 84% of the Metro Vancouver population.
-
TransLink’s 224 million total annual boardings exceeded most American counterparts, including boardings in the Boston and Atlanta metropolitan areas, combined. System-wide ridership recovery also exceeded the average recovery rate across large Canadian and American transit agencies.
-
High-frequency bus services continued to drive ridership across the region.
-
RapidBus routes saw some of the highest ridership in the region, with three RapidBuses ranked among our top 10 busiest bus routes (R1, R4, and R5).
-
Ridership continued to return slightly more on weekends than on weekdays.
-
The Southeast sub-region (Surrey, Langley Township, Langley City, White Rock, and North Delta) was the leader in ridership recovery.
Download the 2021 Transit Service Performance Review
2021 TSPR - CSV Downloads
Bus & SeaBus Data
-
Bus: Average Daily Boardings by Route and Day Type – Fall 2021
-
SeaBus: Average Daily Boardings by Terminal and Day Type – Fall 2021
SkyTrain & West Coast Express Data
HandyDART Data
HandyDART data is available in the 2021 HandyDART Service Performance Review
2020 TSPR - COVID-19 Snapshot
Given the significant impact of the COVID-19 pandemic on transit ridership in 2020, the 2020 TSPR looked a little different than years past. Due to fluctuations in ridership, public health restrictions to non-essential travel, and working from home, there was no “average” day in 2020.
2020's TSPR focused on an eight-week period from September to November 2020, providing a snapshot of ridership trends during the most stable period of the pandemic.
Although ridership declined due to the pandemic, the TSPR illustrates that TransLink provided a vital service for our region in 2020, delivering 621,000 journeys every weekday.
Changes in ridership patterns also illustrate the importance of transit for essential workers and highlight how TransLink tailored its service levels to prioritize routes with the most customers.
Key findings from the 2020 TSPR:
-
85% of our bus ridership continues to be carried on routes that provide frequent service throughout the day and during peak periods.
-
8 of the top 10 busiest bus routes by boardings in 2019 were still among the top 10 routes by boardings.
-
Routes that primarily serve industrial areas were at nearly 70% of 2019 ridership volumes, illustrating that frontline workers were still travelling to and from work.
-
The Southeast sub-region (Surrey, Langley, North Delta, and White Rock) has saw the highest return of bus ridership, with volumes at 55% of 2019 levels, compared to 44% for the overall system.
-
HandyDART customers made almost as many health and medical-related trips in 2020 as they did in 2019. While overall HandyDART ridership was down to 37% of 2019 volumes, HandyDART customers made 100% of dialysis appointment trips, 78% of cancer appointment trips, and 57% of medical appointment trips.
-
TransLink’s ridership levels are consistent with, or above, larger North American metro areas. In September 2020, we had nearly 17 million system-wide boardings, which was more than transit systems in the metro areas of cities such as Boston, Chicago, and Washington, D.C.
CSV Downloads
When you download this data, you are agreeing to TransLink's data license. Please note that bus CSV files do not contain discontinued routes.
Bus Data
SkyTrain & West Coast Express Data
HandyDART Data
Some HandyDART data is included in the 2020 TSPR published report. Further HandyDART data will be available in the forthcoming 2020 HandyDART Service Performance Review.
2019 Transit Service Performance Review
In 2019, our region reached a record of 452.9 million boardings, while ridership grew 3.6 per cent systemwide. This was largely the result of smart planning, strong municipal collaboration, significant service investments, and a sustained focus on improving customer experience. This is a success story for our entire region.
Highlights of our success in 2019 include ridership growth on all modes of transit:
-
Bus boardings increased by 3.8%
-
SeaBus boardings increased by 1.2%
-
SkyTrain boardings increased by 3.2%
-
West Coast Express boardings increased by 4.9%
-
HandyDART boardings increased by 5.7%
Links & Documents
-
-
Note: the 2019 TSPR report contains only data Summary Tables.
-
Report Definitions
CSV Downloads
When you download this data, you are agreeing to TransLink's data license. Please note that bus CSV files do not contain discontinued routes.
Bus & SeaBus Data
-
Bus: Seasonal indicators by route, day type, season, time range, and year
-
SeaBus: Seasonal indicators by day type, season, time range, and year
-
SeaBus: Passenger volume by day type, season, direction, and hour
SkyTrain & West Coast Express Data
-
Rail: Daily passenger volumes by year, line, day type, segment, and direction
-
Rail: Busiest segments by year, line, day type, and time range
-
Rail: Rolling Hour Passenger Volumes by year, line, day type, segment, and direction
HandyDART Data
2018 Transit Service Performance Review
2017 Transit Service Performance Review
2016 Transit Service Performance Review
2015 Transit Service Performance Review
2014 Transit Service Performance Review
2013 Bus Service Performance Review
2012 Bus Service Performance Review
2011 Bus Service Performance Review
2022 HandyDART Service Performance Review
The 2022 HandyDART Service Performance Review (HDSPR) is TransLink’s standalone review of HandyDART service. It focuses on the performance of the HandyDART system, providing an analysis of metrics related to usage and delivery of HandyDART services.
Key findings of the 2022 HDSPR:
-
HandyDART demand grew in 2022 as COVID-19 public health restrictions were eased early in the year.
-
In total, 964,800 HandyDART trips were delivered in 2022, up 39% from 2021.
-
HandyDART customer registrations grew by 22% in 2022, with 6,500 customers registering compared to 5,300 in 2021.
-
Customer ratings for both HandyDART and Supplemental Taxi scored high in overall service, on-time performance, and ease of booking a trip.
Download the 2022 HandyDart Service Performance Review
HDSPR Archive
2021 HandyDart Service Performance Review
The 2021 HandyDART Service Performance Review (HDSPR) was TransLink’s third standalone review of HandyDART service. The report presents trends on HandyDART customer experience and service performance in a one-stop shop.
The 2021 HDSPR examines many of the same metrics as previous reports with a focus on the impacts of COVID-19 on trends.
Key findings of the 2021 HDSPR:
-
HandyDART demand grew throughout 2021 as COVID-19 public health restrictions eased and vaccination rates increased.
-
The majority of trips made by HandyDART customers in 2021 were for three purposes: dialysis (24% of trips), medical appointments (22% of trips), and day programs (25% of trips).
-
HandyDART’s on-time performance hit a record high of 94% of trips delivered early or on-time.
-
Improvements were made to the customer experience on HandyDART with the integration of Compass on HandyDART.
2020 HandyDart Service Performance Review
The 2020 HandyDART Service Performance Review (HDSPR) is TransLink’s second standalone review of HandyDART service, following the inaugural report in 2019. The report presents trends on HandyDART customer experience and service performance in a one-stop shop.
The 2020 HDSPR examines many of the same metrics as the inaugural report, with a focus on the impacts of COVID-19 on trends.
Highlights include:
-
Additional measures such as improved vehicle ventilation, personal protective equipment for drivers, disinfecting, and physical distancing on board were taken to enhance safety during the pandemic.
-
620,000 HandyDART trips were delivered in 2020, down 55% from 2019.
-
In January and February, ridership was greater than 2019, but by mid-March, the impacts of COVID-19 were felt in Metro Vancouver and demand dropped significantly.
-
In the summer months there was a gradual recovery in ridership, but the impacts of evolving public health orders continued to result in reduced demand.
-
The HandyDART system received a total of 880,000 trip requests.
-
An historic high of 94% of trips were reported as early or on-time.
-
Customer ratings for both HandyDART and Supplemental Taxi were high on the following measures:
-
Service overall
-
On-time performance
-
Ease of booking
With the growing and aging demographic in Metro Vancouver, demand for HandyDART is expected to increase in the coming years, especially as the COVID-19 recovery continues. This annual review of the HandyDART service will support transparency and help ensure service quality and customer service performance continue to meet the expectations of HandyDART’s diverse customer base.
2019 HandyDART Service Performance Review
The 2019 HandyDART Service Performance Review is the first standalone review of HandyDART service. This review is sharing the information that advises HandyDART transit planning and investment.
Highlights of the Review include that in 2019, HandyDART delivered trips to 1.56 million customers with high ratings:
-
Customer ratings for both HandyDART and for Supplemental Taxi were high on the following measures:
-
Availability: 8.6/10
-
On-time, reliable: 8.0/10
-
Ease of booking a trip: 8.5/10
-
Cleanliness and good repair of the vehicles: 9.3/10
This review is a benchmark for future HandyDART Service Performance Reviews, providing criteria to measure the growth and improvement of the service.
While the data in the report is not reflective of HandyDART today, we expect demand to continue to grow as the population of the region ages. We're looking at ways to modernize the service and improve the customer experience, beginning in 2021.
Transit Network Review
The Transit Network Review process is part of our ongoing management of the bus network. Reviewing and adjusting the network allows us to best serve customers by relieving overcrowding, increasing the span of service on existing routes and providing new services to communities across Metro Vancouver.
Consultation for the 2019 Transit Network Review took place in April and October 2019. Read the 2019 Transit Network Review Final Report for details.
Due to the financial impacts that TransLink has incurred as a result of the COVID-19 pandemic, some bus and rail service projects that were approved under Phase Two of the Mayors’ 10-Year Vision are currently paused. These projects, and other proposed transit network changes, will need to be considered under a new Investment Plan. Work on a new Investment Plan is currently underway.
Contact
For more information, please email networkreview@translink.ca.
Transit Service Consultation
Transit Service Consultations are a part of our ongoing management of the transit network. This process allows us to listen to feedback from the public, propose service change solutions, and do our best to ensure that proposed changes meet customers’ needs prior to approval and implementation.
Previous Consultations
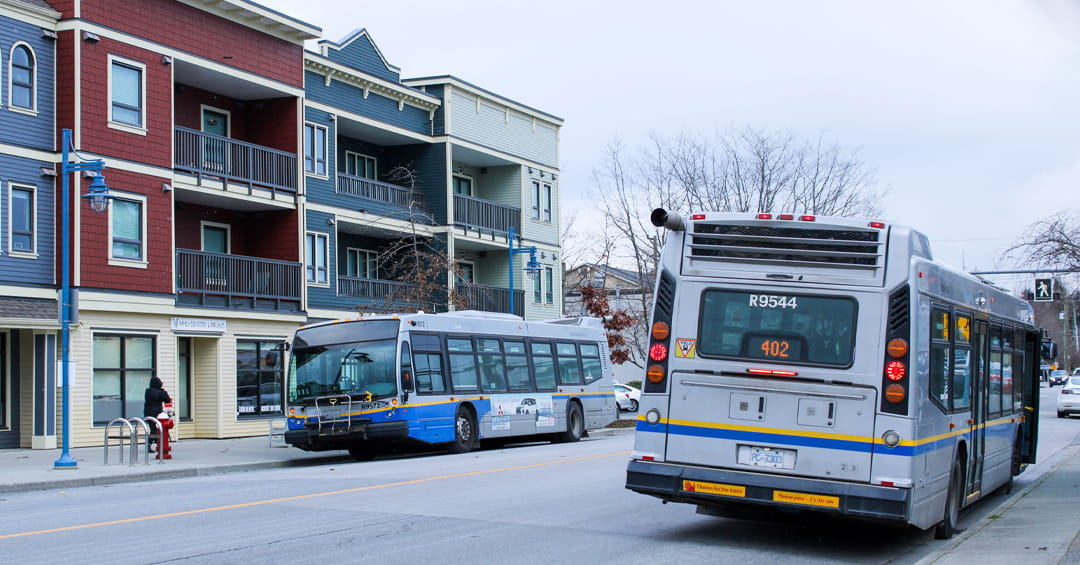
Proposed Changes to Steveston Bus Exchange
Thank you to those who participated in our survey about proposed changes to Steveston Bus Exchange. If you have any questions please email the project team at publicengagement@translink.ca.
In Feb. 2024, TransLink requested public input on proposed changes to the Steveston Bus Exchange that would reduce congestion on local streets, make bus turnarounds more efficient, and better serve customers and the community. This proposal was in direct response to concerns raised by the community about the current bus circulation and bus layover locations in Steveston Village.
The Steveston Exchange public engagement took place from Feb. 12 to March 1, 2024. We'll update this page in the coming months to share our findings. Thank you to everyone that participated!
Proposed Changes
We are proposing changes to bus circulation, relocation of bus layovers, on-street infrastructure upgrades, and enhanced bus shelters that will improve the customer experience and ensure local businesses are visible and accessible.
The proposed changes will allow for more efficient bus operations, improve the customer experience, and reduce impacts for residents and adjacent businesses. Here is a summary of the changes:
-
Moving all bus layover locations to the south side of Chatham Street between Fourth Avenue and Sixth Avenue to reduce congestion in front of businesses,
-
Consolidated bus drop-off and pick-up stops along Chatham Street at Second Avenue to ensure local businesses are visible and accessible,
-
Changes to make bus turnarounds more efficient and provide more direct service to and from the Steveston Village core,
-
Bus traffic reduced in the residential neighbourhood along Fourth Avenue, and
-
Enhanced bus shelters.
Current Bus Routing & Exchange
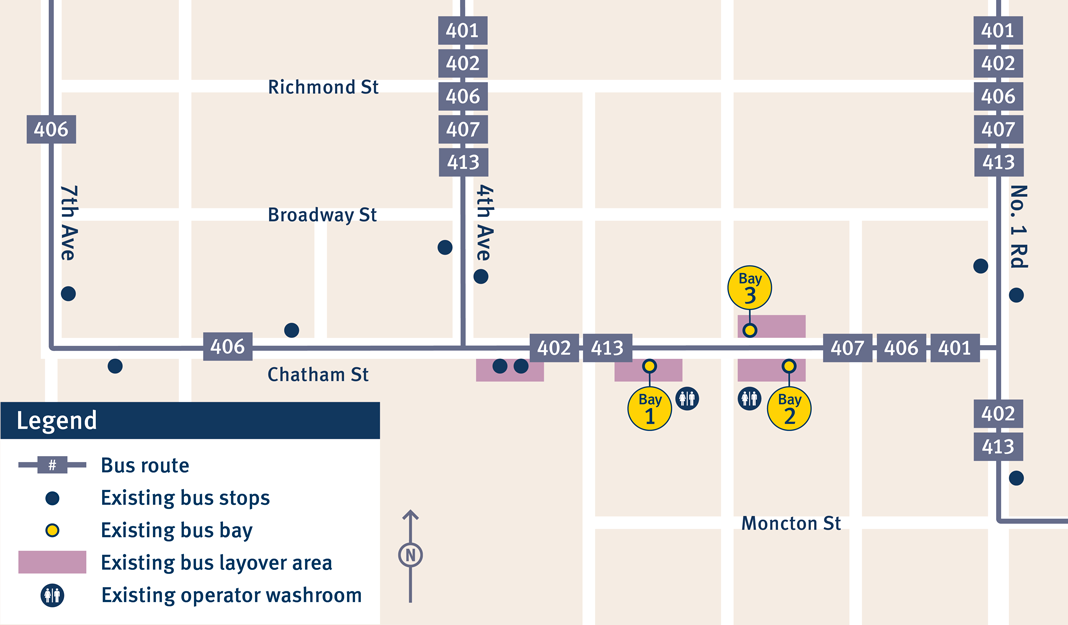
Currently there is no dedicated off-street bus exchange or turnaround, which results in inefficient, and costly bus circulation and impacts local residents along Fourth Ave. Bus layover currently occurs in front of retail businesses on Chatham St.
Existing bus routing through Steveston Village
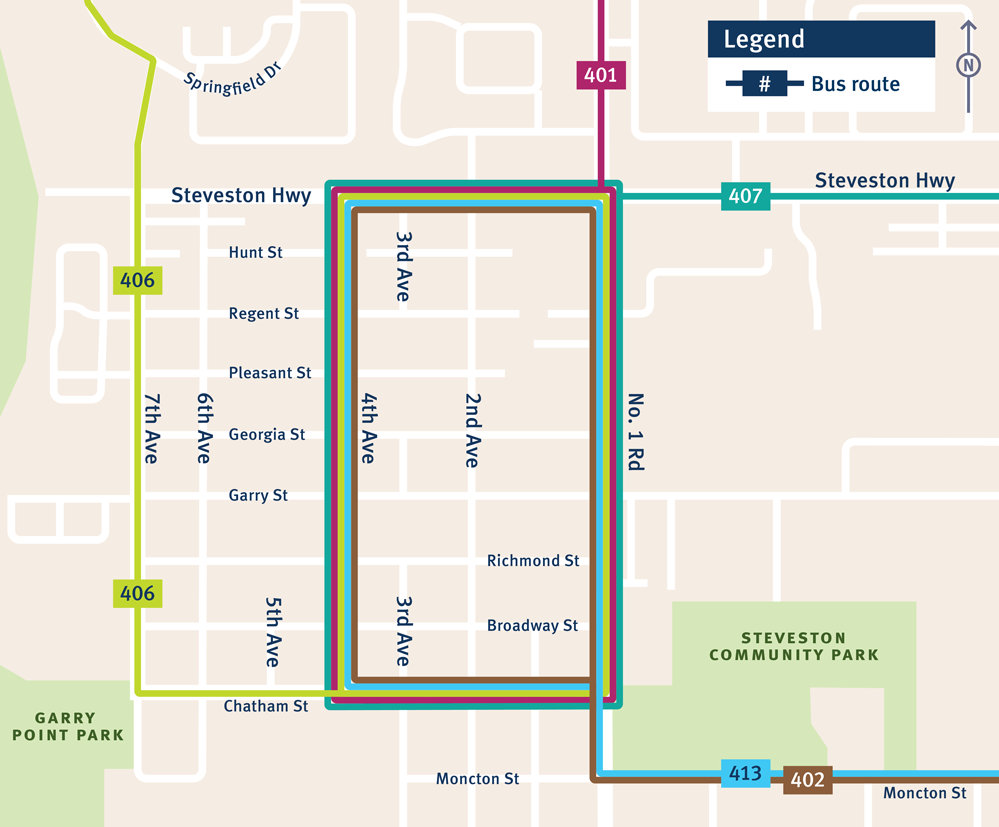
Existing bus stop and layover locations
Proposed Bus Routing & Exchange
The proposed routing through Steveston Village improves bus circulation and reduces bus traffic along the residential section of Fourth Ave. As part of the proposed changes, we’re working with the City of Richmond to consider pedestrian and cyclist safety improvements near Garry Point Park.
Proposed bus routing through Steveston Village
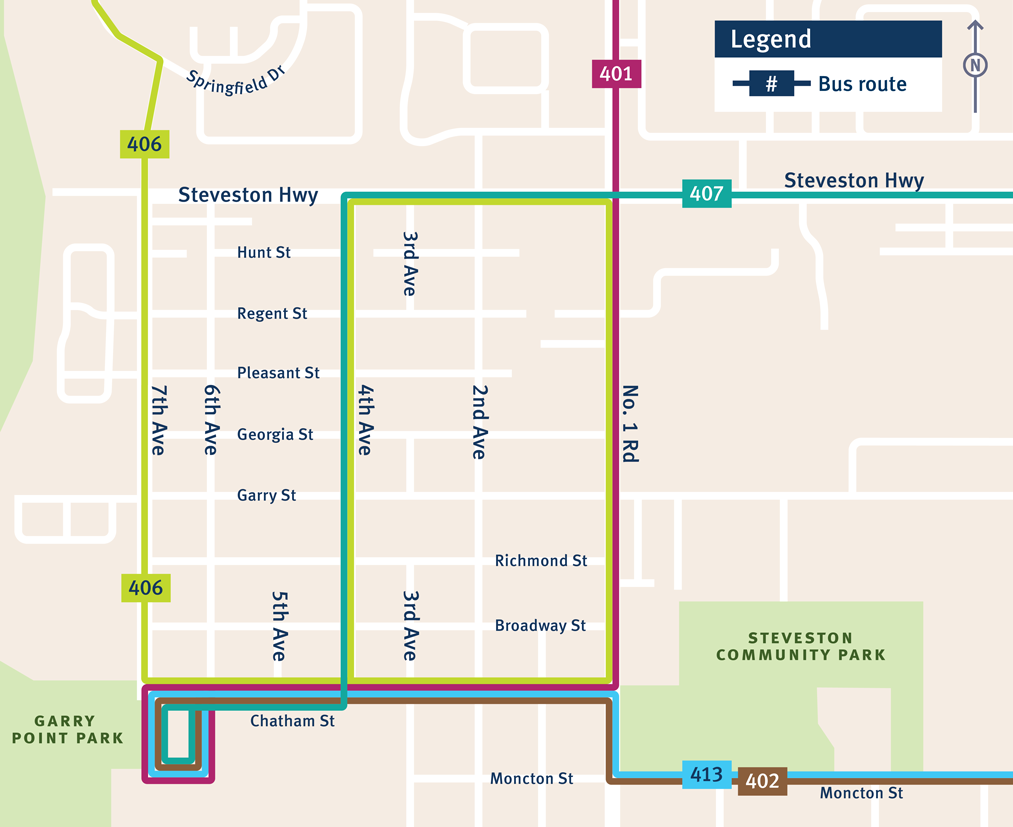
Proposed bus stop and layover locations
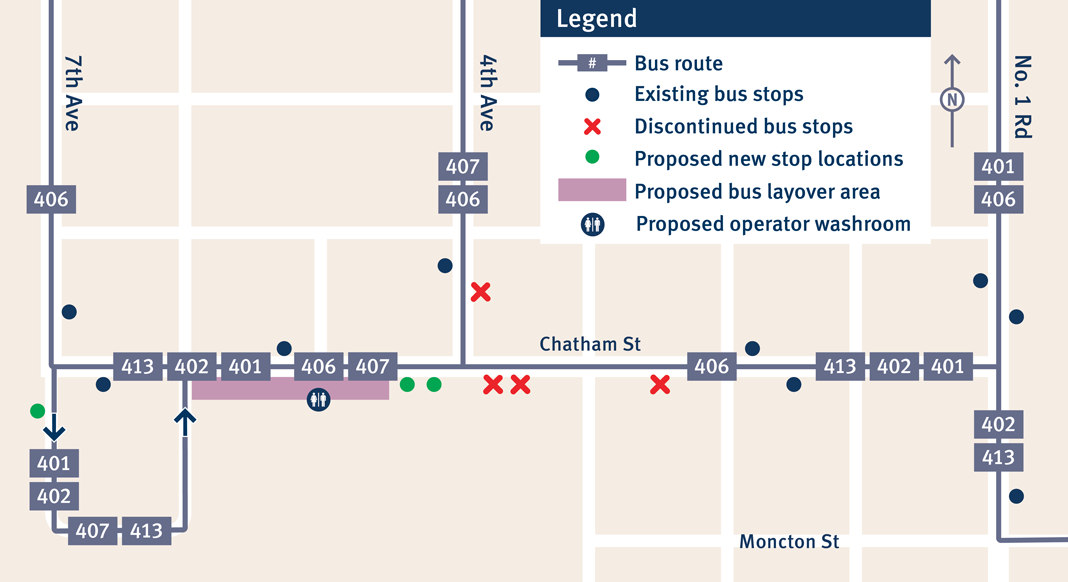
Proposed bus stop and layover locations - details
The current layout of the Steveston Bus Exchange includes layovers in front of several local businesses. Over the past several years, TransLink and the City of Richmond have collaborated on plans to improve the Steveston Bus Exchange and mitigate ongoing concerns from Steveston Village residents and businesses. We are working towards moving to an off-street bus exchange and are continuing to monitor the availability of potential properties in the area.
Proposed Service Improvements to 23 Main St Station/English Bay
Thank you to those who participated in our survey about proposed changes to Route 23 Main St Station/English Bay. If you have any questions please email the project team at publicengagement@translink.ca.
Proposed Changes
In partnership with the City of Vancouver, TransLink has identified proposed changes that will reduce overcrowding and pass-ups on route 23 by allowing 40-foot buses to serve the route.
Road constraints, particularly on Keefer St., Beach Ave., and Bidwell St., require a route change to allow larger buses to operate on route 23. The proposed new route:
-
Shifts westbound service from Beach Ave. to Pacific St. between Howe St. and Jervis St.
-
Shifts westbound service from Keefer St. to Expo Blvd. between Quebec St. and Pat Quinn Way.
-
Adds service past the current terminus at Davie St. and Bidwell St., along Denman St. and Robson St. to the new terminus at Burrard Station.
The proposed changes to route 23 include the addition of 22 bus stops. Six brand new stops will be installed along the route, and under the proposed changes, 16 existing bus stops that currently serve other routes in Downtown Vancouver will serve route 23’s extension to Burrard Station.
To make route 23 better, faster, and more reliable, we are carefully consolidating or removing some of the closest bus stops to balance convenient access and travel time for customers. When bus stops are too close together, customers spend more time waiting and service is less reliable. To support the proposed changes, 17 bus stops along the route would be removed. Some of the bus stops would be removed due to routing changes and others removed to balance convenient access and travel time for customers. Please see the map below for more details.
The removal of these bus stops will lead to more comfortable rides with less stopping, starting, and lane changing, and will help customers get to their destination faster.
Alternative Routes for the 32 Dunbar/Downtown
Thank you to those who participated in our survey about the alternative routes to Route 32. If you have any questions please email the project team at publicengagement@translink.ca.
Route 32 was suspended in early 2020 to reallocate service to busier routes that required more space for social distancing during COVID-19. The decision was made because ridership was low on this route, there were alternative routes with available capacity for customers, and resources were more in need on other routes with higher ridership. The 32 remains suspended to better allocate resources to the routes that need them most.
If you previously rode the 32, we want to better understand how the alternatives (Routes 2 and 7) are working for you and if your journey could be improved.
Proposed Changes to Route 531 White Rock Centre / Willowbrook
Thank you to those who participated in our survey about proposed changes to Route 531 White Rock Centre / Willowbrook. If you have any questions please email the project team at publicengagement@translink.ca.
Stakeholders in the Campbell Heights neighbourhood, including the local business community and individual businesses, have identified areas for improvement on Route 531 White Rock Centre / Willowbrook.
Key Issues
-
Bus stop spacing and distance from businesses are too far, resulting in 20-minute walks for some employees.
-
There is a need to improve connections to key locations from Campbell Heights via transit.
Proposed Changes
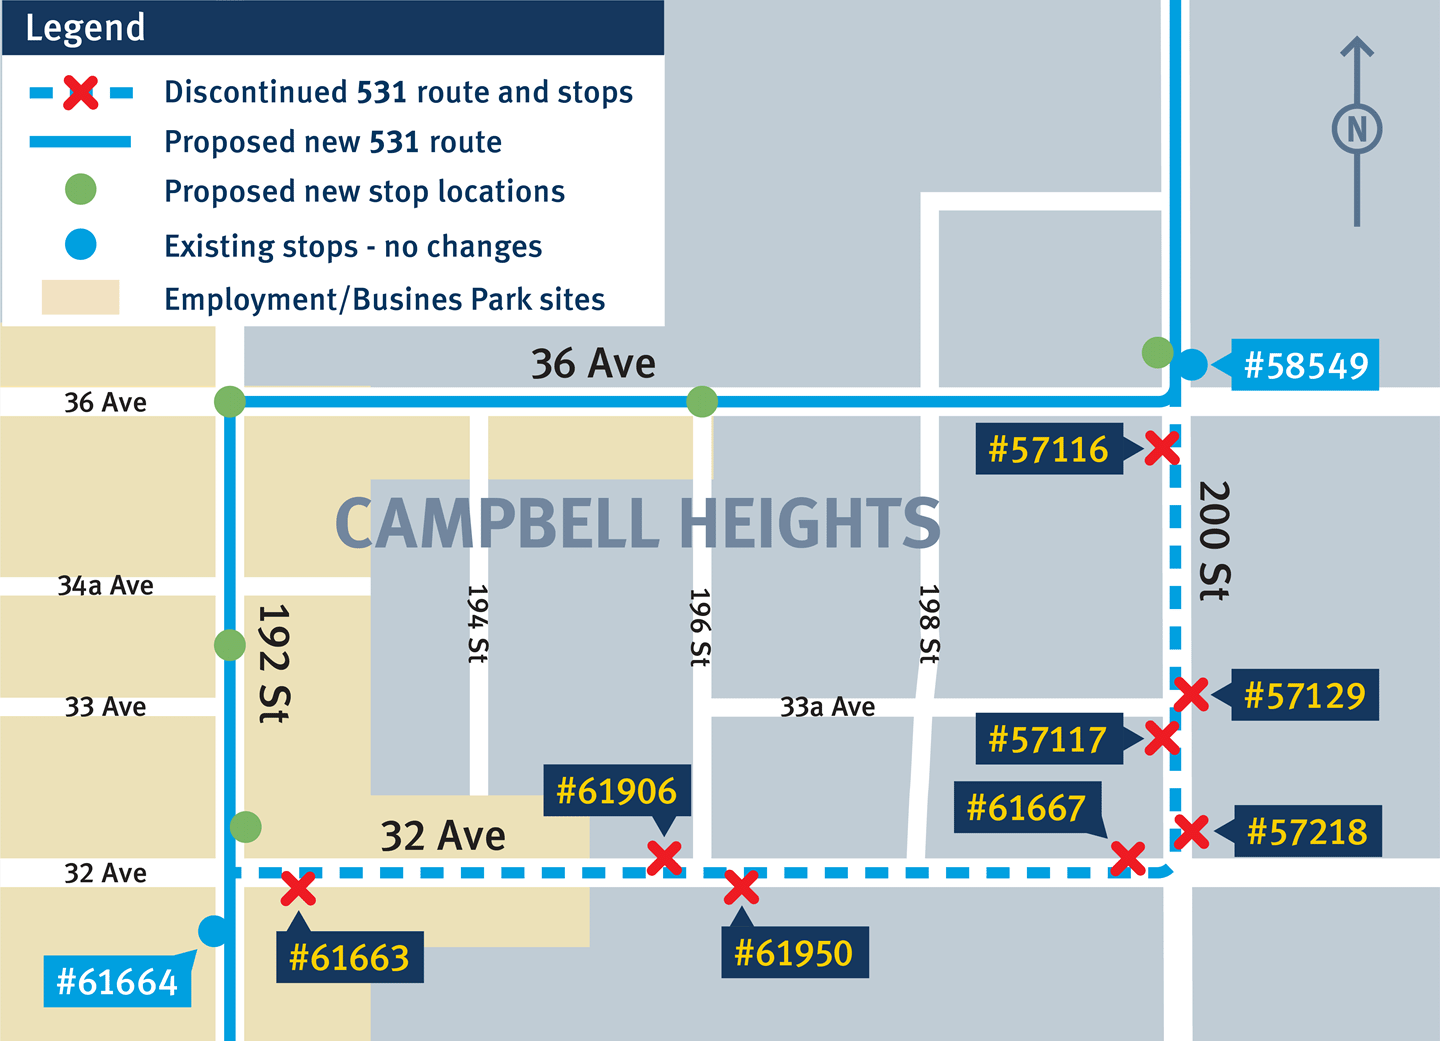
-
Change the current 531 routing to increase the number of stops within a reasonable walking distance to local businesses.
-
Proposed new routing:
-
Northbound: 192nd Street to 36th Ave then travel east along 36th Ave to 200th St, then continue north along 200th St and resume regular routing.
-
Southbound: 200th Street to 36th Ave then travel west along 36th Ave to 192nd, then continue south along 192nd and resume regular routing.
-
To support this routing change, six bus stops would be relocated and two bus stops would be moved closer to their existing intersection.
-
Proposed stop locations are for illustrative purposes and are subject to change as part of the detailed design process
Benefits
-
We expect the proposed routing to improve travel for many existing customers and better serve those walking long distances to access businesses.
-
A preliminary evaluation of the proposed change has shown that this could be achieved at no cost, with minimal impact to existing customers. This makes the proposed change the most feasible near-term solution to address issues raised by customers and the local business community.
-
Improved access to employment sites may also generate more ridership than we are seeing at the existing stops.
Customer Impacts
-
We expect that changing this routing would potentially impact a maximum of approximately 18 daily customers.
-
Customers at discontinued bus stops would be required to walk 500 to 800 metres to catch the 531.
Contact Us
For more information, please email publicengagement@translink.ca or sign up for TransLink Newsletters to stay up-to-date on all our major projects.
Mobility Pricing
Mobility pricing refers to the suite of fees for using everyday transportation services. These include tools like transit fares, bridge tolls, road usage charges, and fees for any other services involved in the movement of people and goods.
Mobility Pricing Independent Commission
The Mobility Pricing Independent Commission was a group of 14 Metro Vancouver representatives from a variety of organization across the region. They were selected and tasked by the TransLink Board of Directors and the Mayors’ Council on Regional Transportation to evaluate and make recommendations on how to develop and implement a regional road usage charging policy and system, and assess the implications for pricing of other types of transport and mobility.
Between July 2017 and May 2018, the Mobility Pricing Independent Commission led the It’s Time project, an extensive research and engagement project that studied ways to reduce congestion, promote fairness, and support continued investment in transportation. This included engagement with more than 17,000 Metro Vancouver residents through:
-
Online engagement;
-
In-person meetings with nearly 200 stakeholders and elected officials; and
-
Three workshops with a 15-member user advisory panel representative of Metro Vancouver’s diverse population and geography.
Findings
In May 2018, the Commission shared their findings with the Mayors’ Council and TransLink Board of Directors in a joint meeting. In the report a set of principles to follow were identified when designing mobility pricing in Metro Vancouver. Two concepts which were explored were also shared in the report:
-
A regional congestion point charge with charge points at, or close to, some or all of the regionally important crossings, complemented by further point charges at locations within the Burrard Peninsula; and,
-
A distance-based charge with two or more zones with varying charge rates throughout Metro Vancouver.
Both concepts show promising results, and they will require more analysis, including further study of the potential for decongestion charging to coordinate with transit fares and other forms of mobility pricing. The Commission is also recommending further assessment of affordability and equity impacts, an assessment of available technology for distance-based charging, and a study of impacts for business, particularly transport-intensive businesses.
Related Documents
-
Mobility Pricing Independent Commission Final Terms of Reference
-
Mobility Pricing Independent Commission: Metro Vancouver Mobility Pricing Study (Final Report)